
Peru truck and bus sales rise 40.4% through August
The Automotive Association of Peru reported 21,572 heavy vehicle sales in the first eight months of 2026. Trucks and tractor units grew faster than minibuses and buses.
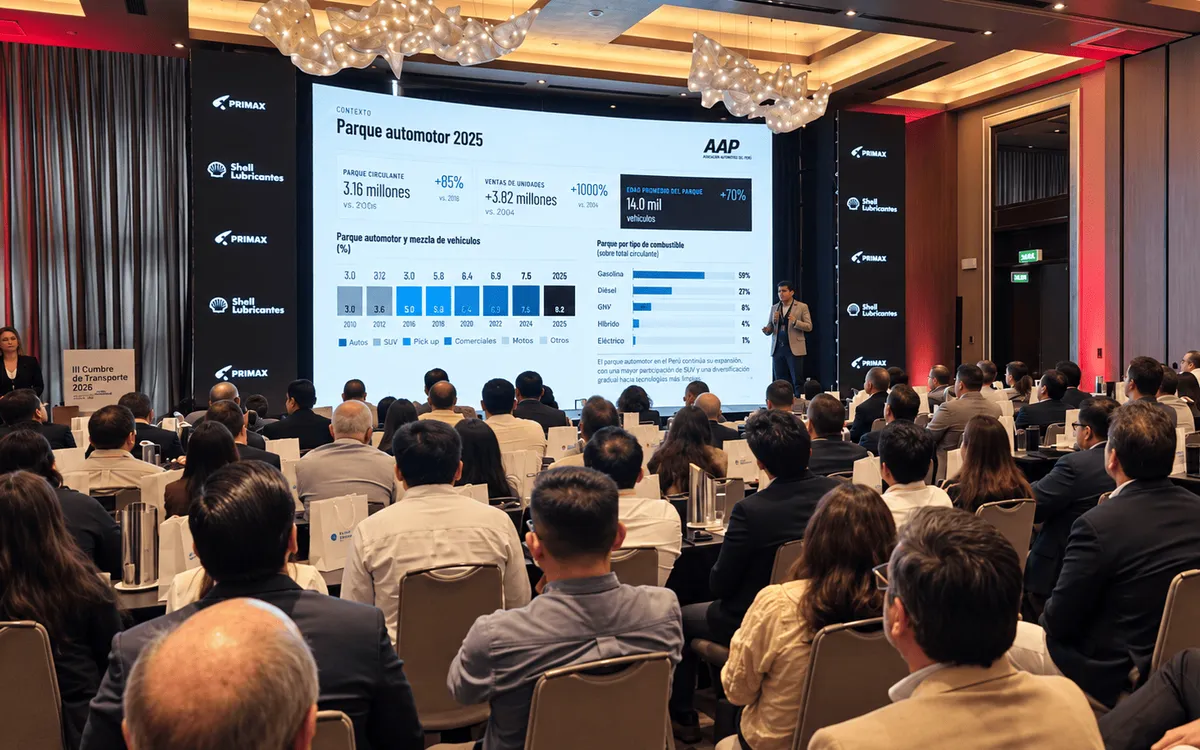
Peru’s Automotive Association said on September 17 that 21,572 trucks and buses were sold in the first eight months of 2026, up 40.4% from the same period a year earlier. The association presented the figures at the third Transport Summit, organised by Primax. It linked growth to private investment, financing conditions, the exchange rate and vehicle availability.
The association’s August market report breaks down the total by type of vehicle. It records 18,491 trucks and tractor units, up 43.3%, and 3,081 minibuses and buses, up 25.1%. Both comparisons cover January through August. Freight vehicles accounted for about 86% of the combined units, so their faster growth had more influence on the overall result than the smaller passenger vehicle category.
AAP linked truck demand to private investment in sectors including mining, construction, commerce and logistics. In its market report it said that those industries need vehicles to carry inputs and finished goods and had encouraged operators to renew and expand fleets. It attributed the bus and minibus growth to a different set of needs, including passenger transport, tourism activity and companies moving workers. A purchase for one of those services may require a different body, specification or operating schedule from a freight vehicle.
The association forecast full-year growth of 33.2% for trucks and 16.4% for buses. Those are forecasts for 2026, while the earlier figures measure sales already recorded over eight months. The forecast rates are lower than the recorded gains for the two categories. AAP also said it expected growth rates to moderate in 2027, with volumes remaining at elevated levels. It did not give a forecast number in units for 2027 in the summit report.
For dealers, lenders and body builders, the split gives more information than the combined growth figure about where vehicles have been delivered. The association’s annual projections offer a separate indication of how it expects the year to finish. An operator planning replacement can use the reported market data to see the scale of activity but still needs to compare delivery schedules and financing for its particular vehicle. The summit disclosure described a growing market across freight and passenger vehicles, with trucks accounting for the larger share of units and the bigger percentage increase.