
Manheim’s mid-October used-vehicle index rises as wholesale supply eases
The preliminary U.S. index reached 207.4 in the first fifteen days, while unadjusted prices fell 2%. Cox reported wholesale supply of 28.2 days on October 15.
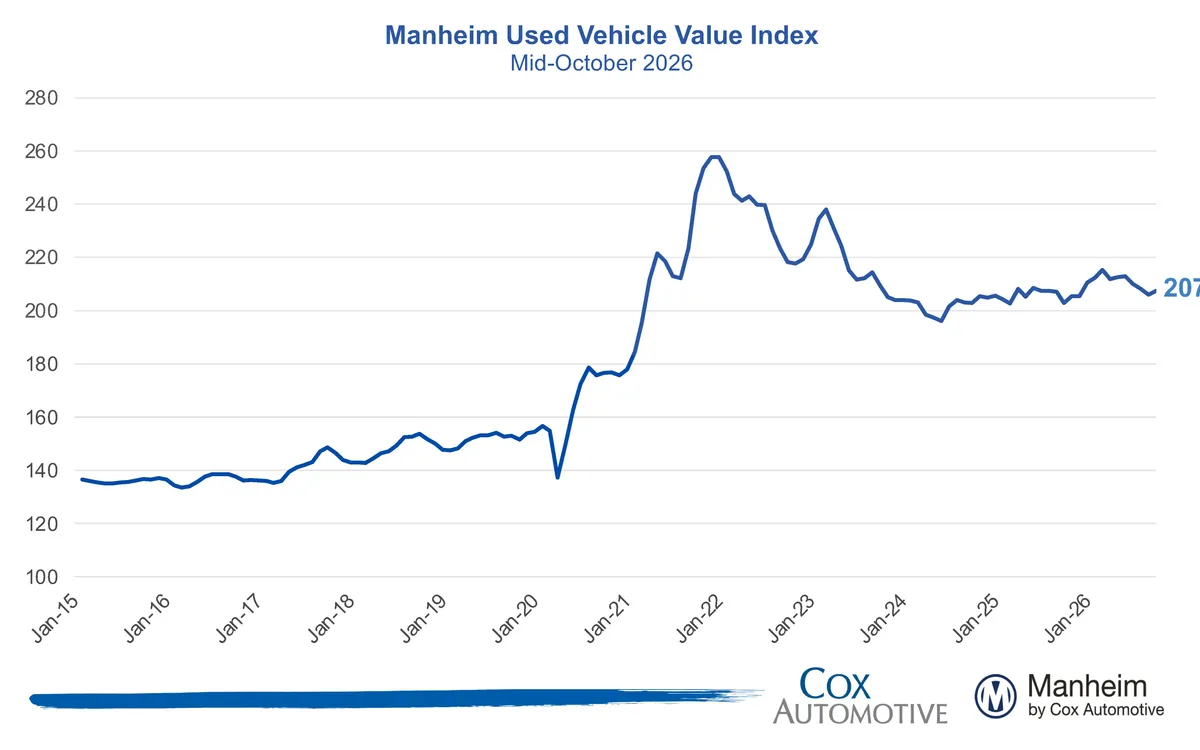
Cox Automotive reported on October 19 that the Manheim Used Vehicle Value Index rose 0.7% to 207.4 in the first 15 days of October compared with September. The preliminary wholesale index, which adjusts for vehicle mix, mileage and seasonality, ran 2.2% above October 2025. Unadjusted prices dropped 2% from September and were 0.5% above the year-earlier comparison.
The rise followed a weak September. Cox’s full September release put the adjusted index at 205.9, down 1.1% from August. In the October period, raw wholesale prices had already dropped by more than their typical 1.5% decline for a full October. The adjusted gain shows how prices moved after accounting for factors such as the seasonal pattern. Cox noted that the comparison with October 2025 also started from a relatively weak period.
Wholesale supply fell to 28.2 days on October 15 from 28.7 days at the end of September, based on the benchmarks used in the midmonth report. It was still about one day above the year-earlier level. Cox’s analyst said leaner wholesale stock appeared to be helping prices after seasonal adjustment. That is an interpretation of concurrent changes in supply and pricing, and the preliminary release does not establish that demand increased.
Conversion across reported sales averaged 54.3%, up 0.3 percentage points from a year earlier. Cox’s retention measure averaged 98.9%. That measure relates sales prices to its valuations, so it describes a different part of auction activity. Its separate price series for three-year-old used vehicles fell 1.2% from the beginning of October. Taken together, the figures show relatively stable conversion alongside some declines in prices for the younger vehicles.
Manheim’s EV index was 6.8% above a year earlier and down 0.7% from September, while the non-EV index was up 1.3% year over year and 0.7% from September. The two markets moved in different directions in the early-October comparison. Among vehicle classes, Cox said compact cars were 5.6% higher than a year earlier. Midsize cars had turned positive, while pickups and luxury vehicles remained below last October. For dealers, both the tighter reported wholesale supply and the split between electric and other vehicles affect how to read the national number. The 207.4 figure covers only the first half of October, and the full-month report will incorporate the rest of the month’s auction activity.